
Notable demographic shifts, a pronounced housing shortage, and an affordability crisis are converging to change the shape of global housing markets.
Global Living Reimagined
Executive Summary
The current housing supply shortage and affordability crisis is very real—and it’s also global. By Hines’ estimates, the global housing market across a group of key developed economies that Hines Research analyzes tells us that we need a net 6.5 million housing units to meet current demand. This lack of supply has caused a global affordability crisis, putting many major markets out of reach for potential homebuyers. One important and potentially unexpected outcome has been a pronounced global proclivity to rent: Over 80% of households in the developed economies we analyzed were in country markets showing clear momentum for renting over buying.1
Against this backdrop, we see some important opportunities emerging for global real estate investors:
- Overall, the traditional apartment (multifamily) sector offers compelling performance attributes globally as the popularity of renting trends upward. A shortage is calling for new supply, and in Europe and Asia, the size of the institutional quality and fit-for-purpose market trails the U.S. by such a large margin that catching up is a powerful force behind new development. Meanwhile, unique demographic and market trends support region-specific strategies.
- As a growing population of U.S. renters ages into their prime child-rearing years, we are seeing increased demand in the single-family rental (SFR) market. We observe similar trends occurring globally as well.
- There’s a specific opportunity forming in Europe’s student housing sector, as that population segment continues to climb—along with rent growth in locations where they settle.
- In Japan, we see the potential for continuing attractive returns in the for-rent space, now driven by a secular shift in rent growth rather than the cap-rate compression experienced in previous years.
- South Korea is another geography we believe is poised to evolve into an institutionally investible market.
Over 80% of households in the developed economies we analyzed are in country markets showing clear momentum for renting over buying.
attribution
The Housing Shortage Is a Global Story
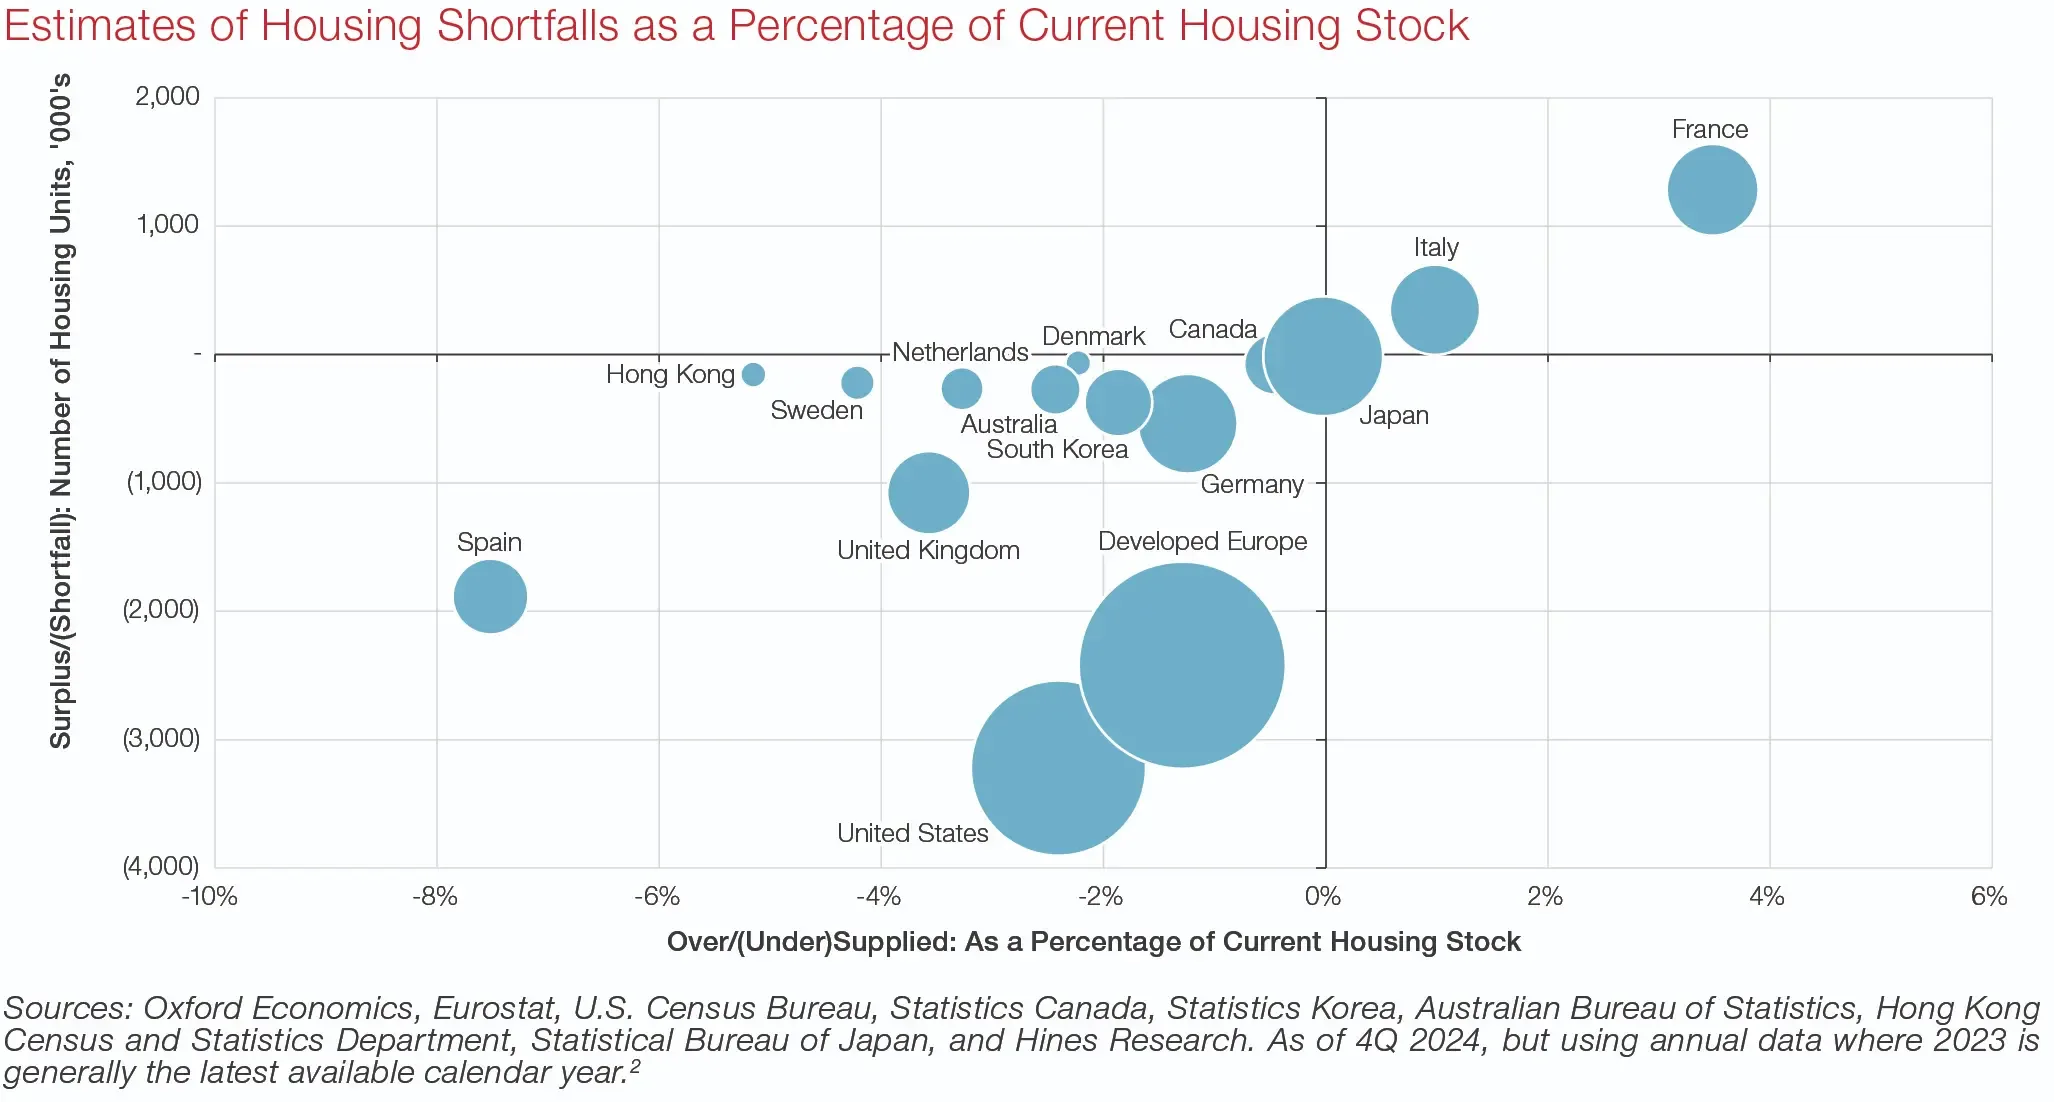
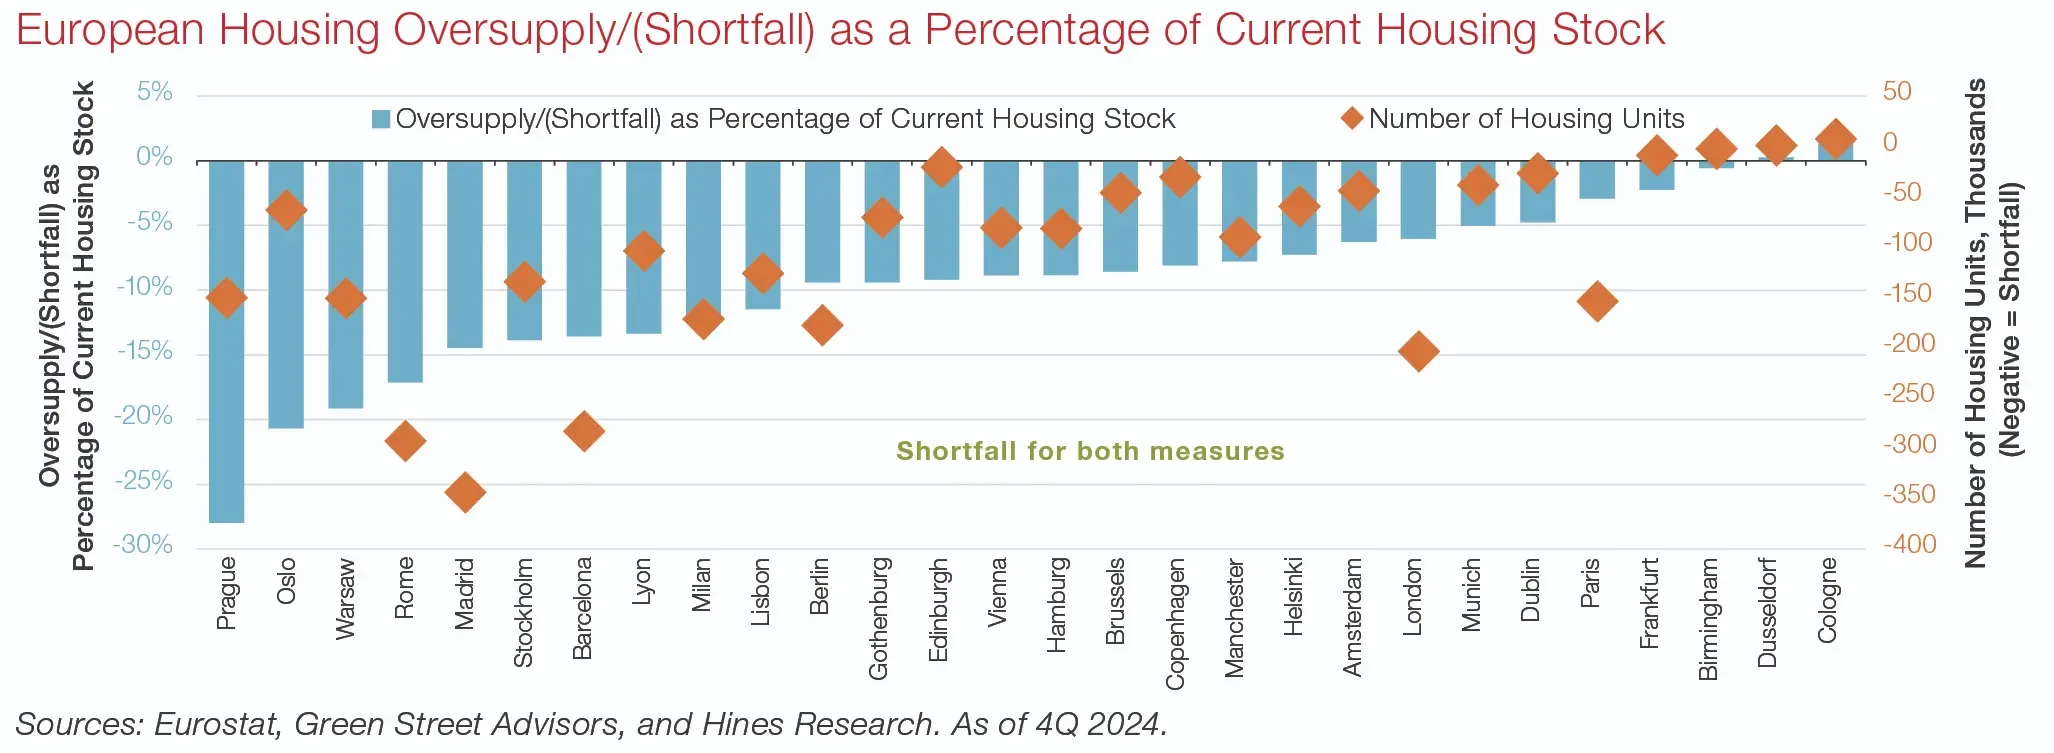
The lack of housing in the U.S. is a story well-told and understood, but the reality is that we are facing a truly global housing shortage across major developed economies. As mentioned above, Hines estimates that over the group of developed economies that we track, we need a net 6.5 million housing units— with notable deficits in both the U.S. and developed Europe (See Exhibit 1). Even in markets classified as “oversupplied” from our analysis (such as France and Italy), major cities in those countries are, in fact, actually quite undersupplied (such as Paris and Milan).
Exhibit 1: Estimates of Housing Shortfalls as a Percentage of Current Housing Stock
Global Home Unaffordability at Near Historic Levels
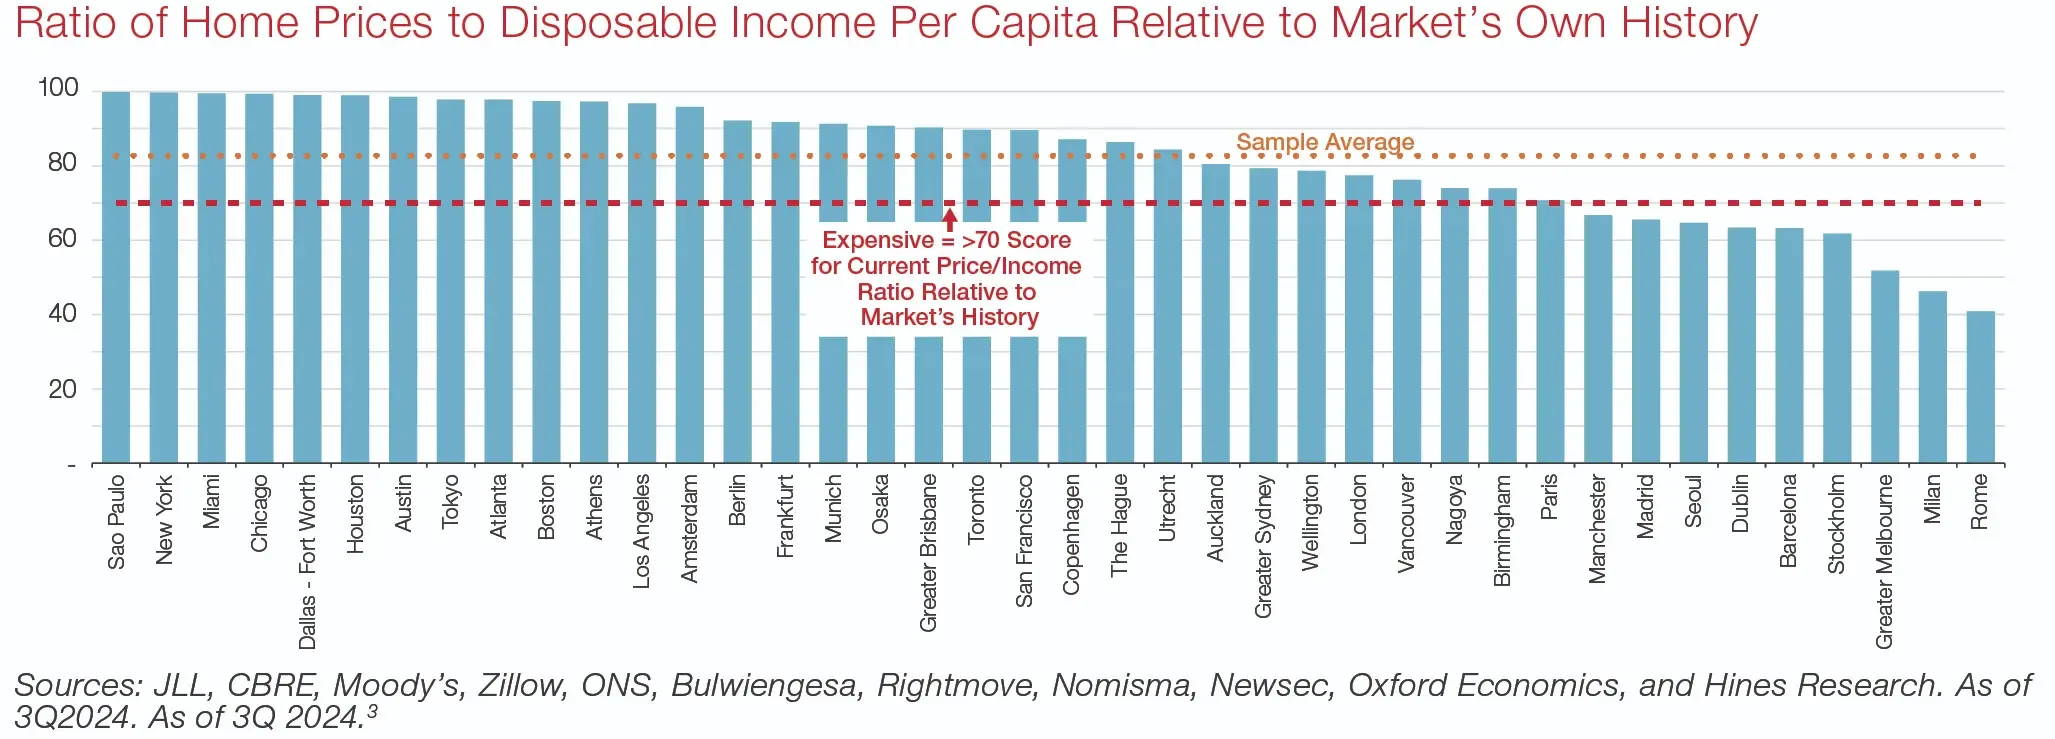
With these housing shortages have come notable increases in home prices, in many cases becoming as expensive as they’ve ever been if using a ratio of home prices to incomes. Exhibit 2 illustrates just how expensive home prices have become globally. The scoring methodology used by Hines Research in this analysis of 50 markets leverages a scale of 0 – 100, with a score of 100 signaling that the current home price ratio to disposable income per capita (a measure available across global metro markets) is as high as they’ve ever been. We are comparing those current ratios to each market’s own history, an approach that makes the results comparable across markets despite significant dispersion in the data used across all the metro markets shown. Another nuance is that there may be markets, such as Spain, where housing prices feel expensive, but the current ratio is below historical peaks due to either falling prices or, in the case of Spain, rising household income.
Despite these complexities, the message from this analysis is straightforward. Using this scoring methodology, Hines Research views a score above 70 as expensive, and only a handful of markets sit below that threshold. Even more impressively, the average score for this sample set exceeds 80 (with many cities above 90 and even at the 100 mark).
Exhibit 2: Ratio of Home Prices to Disposable Income Per Capita Relative to Market’s Own History
A Global Proclivity to Rent
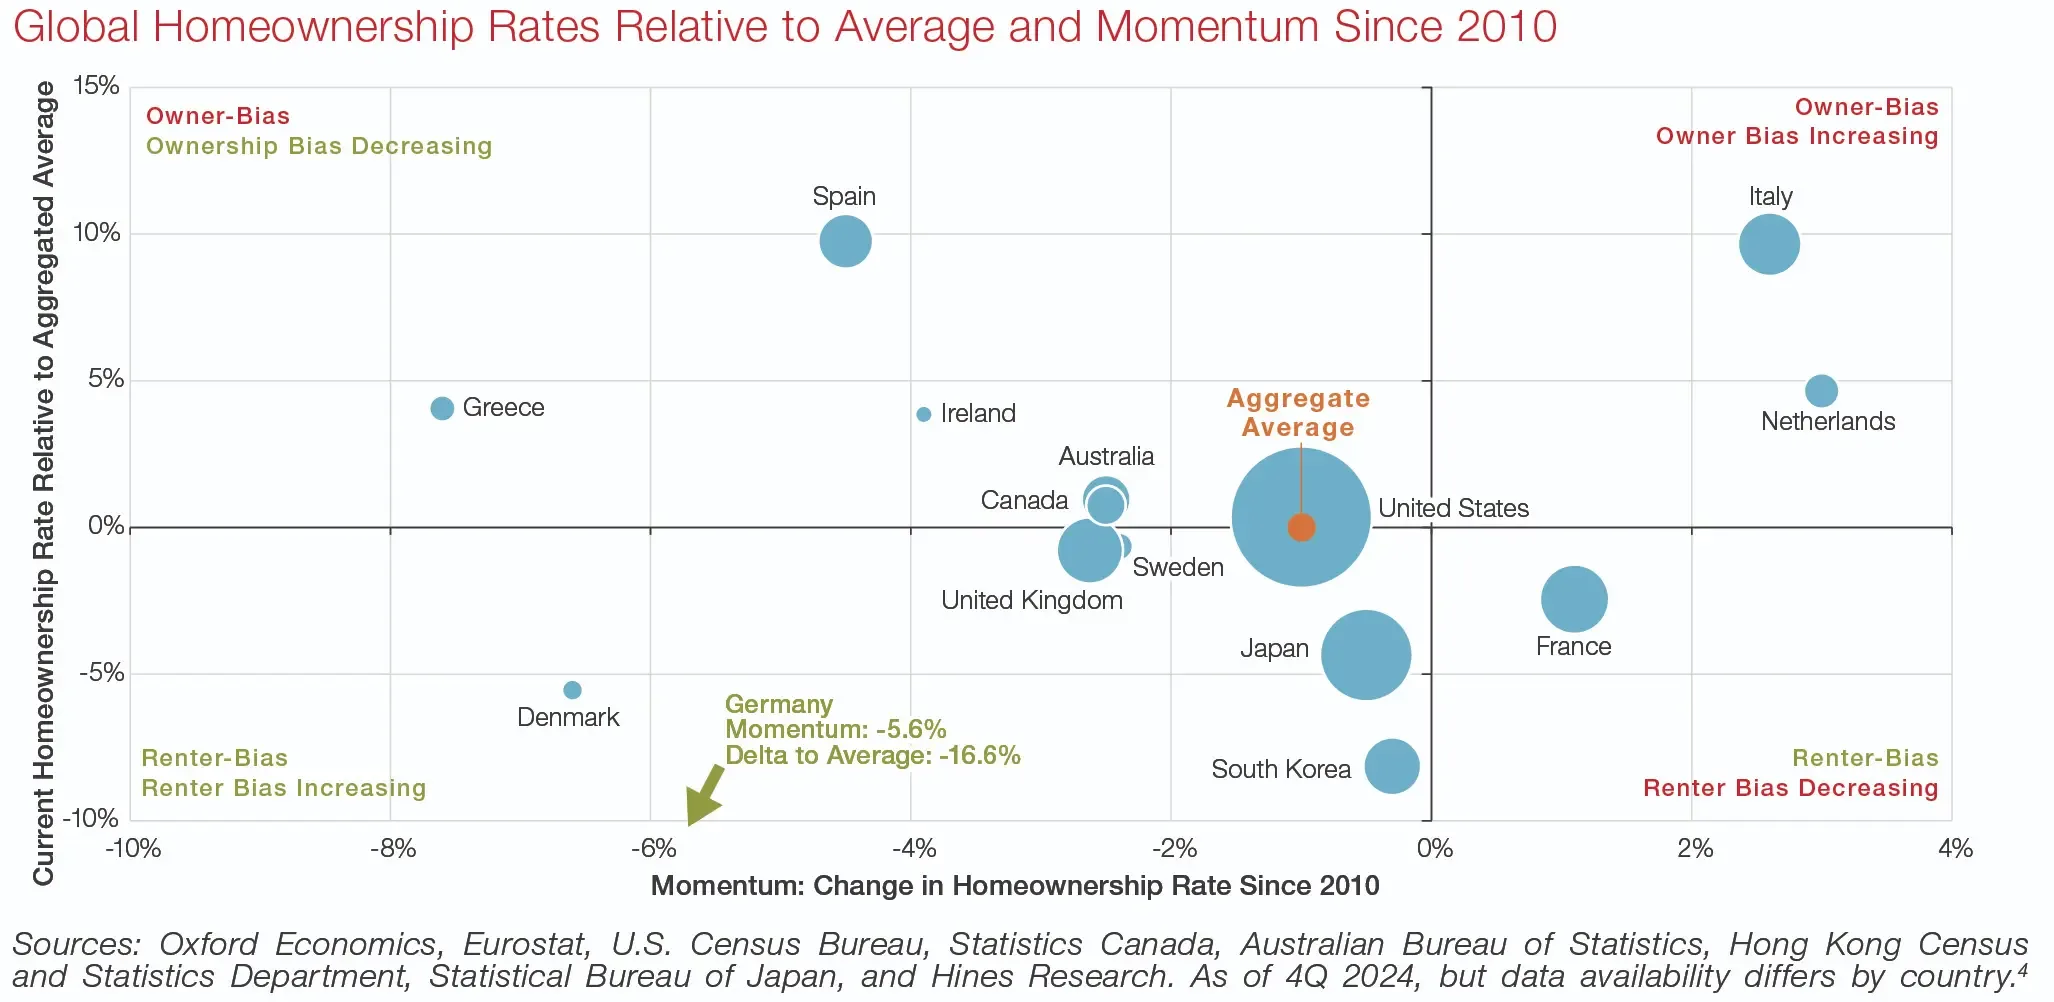
With home price unaffordability prevalent across many markets, there has been a pronounced shift toward renting—what we’re calling a “proclivity to rent.” In Exhibit 3, Hines Research found that outside of France, Italy, and the Netherlands, momentum (as measured by the change in the homeownership rate since 2010) clearly favors renting over buying. In these markets, renter households have grown by about 15.4%, versus 8.5% for homebuying households over the same period. While the aggregate average for these markets has seen homeownership only fall by about 1%, that change is highly significant in a global context. If homeownership rates had stayed at 2010 levels, 5.7 million fewer renter households would have been added. Rather than trailing, home-buyer households would have outgrown renter households by 10.4% to 9.9%.
When viewing this landscape through the lens of an investor, the traditional apartment (multifamily) sector becomes increasingly attractive. Furthermore, from a long-term perspective, the global apartment sector has historically generated compelling performance attributes. We like to characterize the apartment (for-rent residential) sector as “first in, first out,” meaning that apartment values and rents tend to drop first among the major sectors during times of uncertainty, but are often the first to recover.
This, in itself, offers a form of stability, and is partially a result of the typical one-year lease structures for the living sector. So, market demand can feed directly into almost a real-time mark to market both on the downside and the upside. Hence the V-shaped nature of apartment rental recoveries implied by this analysis. A noteworthy caveat here: While rent regulation in some markets may cap upside in terms of marking rents to market (meaning increases may be limited or capped), that also may provide downside protection, for example in many Continental European markets with longer-term leases and rent controls.
Exhibit 3: Global Homeownership Rates Relative to Average and Momentum Since 2010
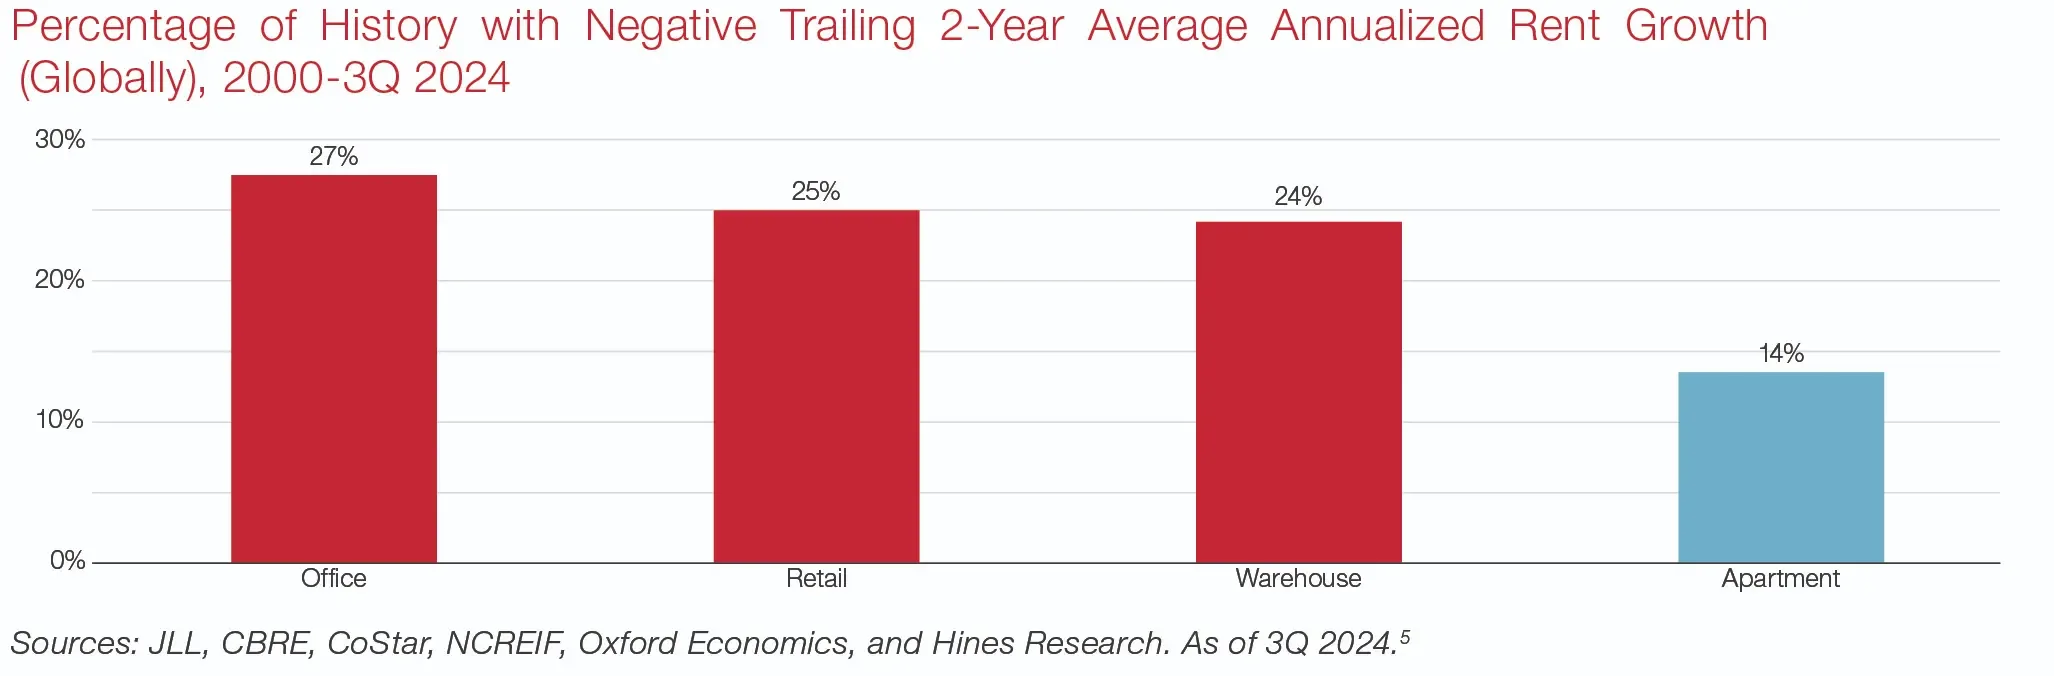
Additionally, the fact remains that people need a place to live. So, while decisions to find a home can be put off during periods of economic or capital markets turmoil, that decision is revisited as soon as possible, supporting, once again, a V-shaped recovery in demand. To illustrate this point, we looked at historical rent growth across real estate sectors globally in Exhibit 4. In this context, the apartment sector experienced two consecutive years of rent declines only 14% of the time since 2000—about half the average experienced by other property types.
Exhibit 4: Percentage of History with Negative Trailing 2-Year Average Annualized Rent Growth (Globally), 2000-3Q 2024
Trends in the North American Living Sector
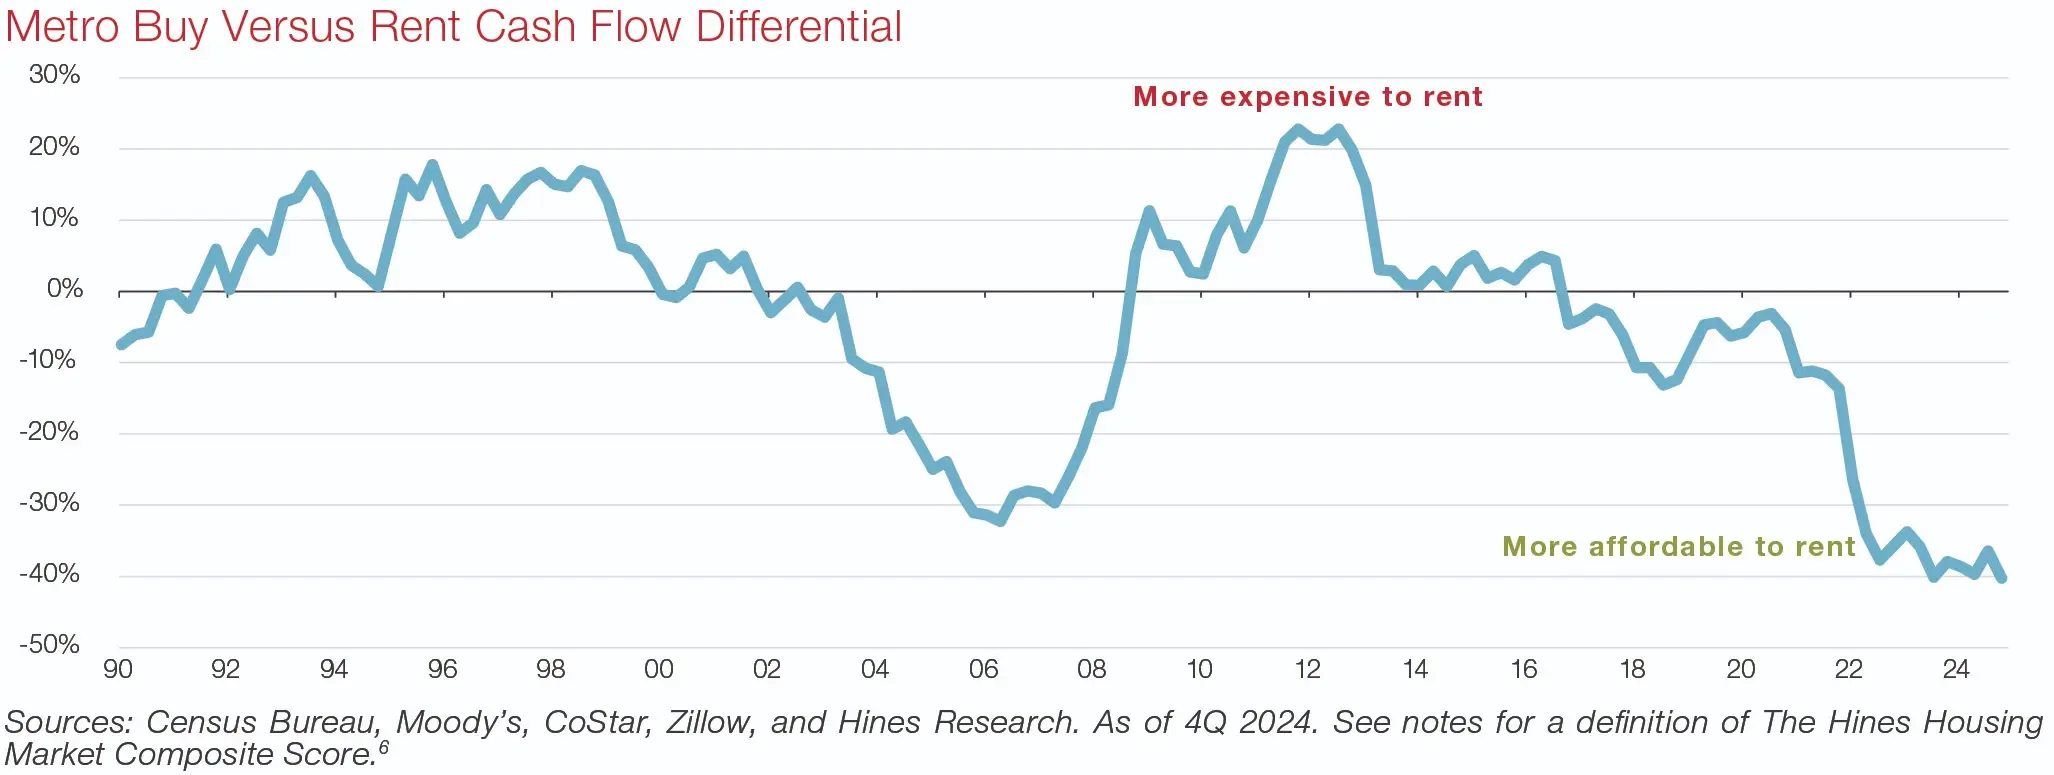
Living sector trends in the U.S. and Canada mirror the global picture we’ve already painted. There’s an acute housing shortage (for example, the U.S. is short by over three million units by our estimates), resulting in a historic housing affordability crisis. In this environment, renting has become more affordable than buying. In Exhibit 5, Hines Research compares the relative attractiveness of renting versus buying based on a comparison of rents vs. overall costs to buy (including mortgage, taxes, and insurance), a detailed analysis that can be performed in the U.S. where the data are available. Over the period for which we have data, this analysis found that home prices have never been more unaffordable. Conversely, on a relative basis, renting has never been more attractive vs. buying.
In Canada, we found less evidence of a shortfall in housing (relative to the U.S.). However, unaffordability in the major metros (such as Toronto and Vancouver) is just as, if not more, intense. The result has been an even more substantial reduction in the Canadian homeownership rate (per Exhibit 3) than in the U.S., providing support for living investment there as well.
Exhibit 5: Metro Buy Versus Rent Cash Flow Differential
Tailwinds for U.S. Single Family Rentals (Detached and Townhomes)
While the U.S. renter cohort (a younger 20-34 cohort that supports demand for traditional multi-family most directly) is no longer providing the natural growth that had been such a tailwind for multifamily development and acquisitions for almost two decades, the opportunity for traditional multifamily apartments remains compelling given the aforementioned shortage, as pent-up demand is likely substantial.
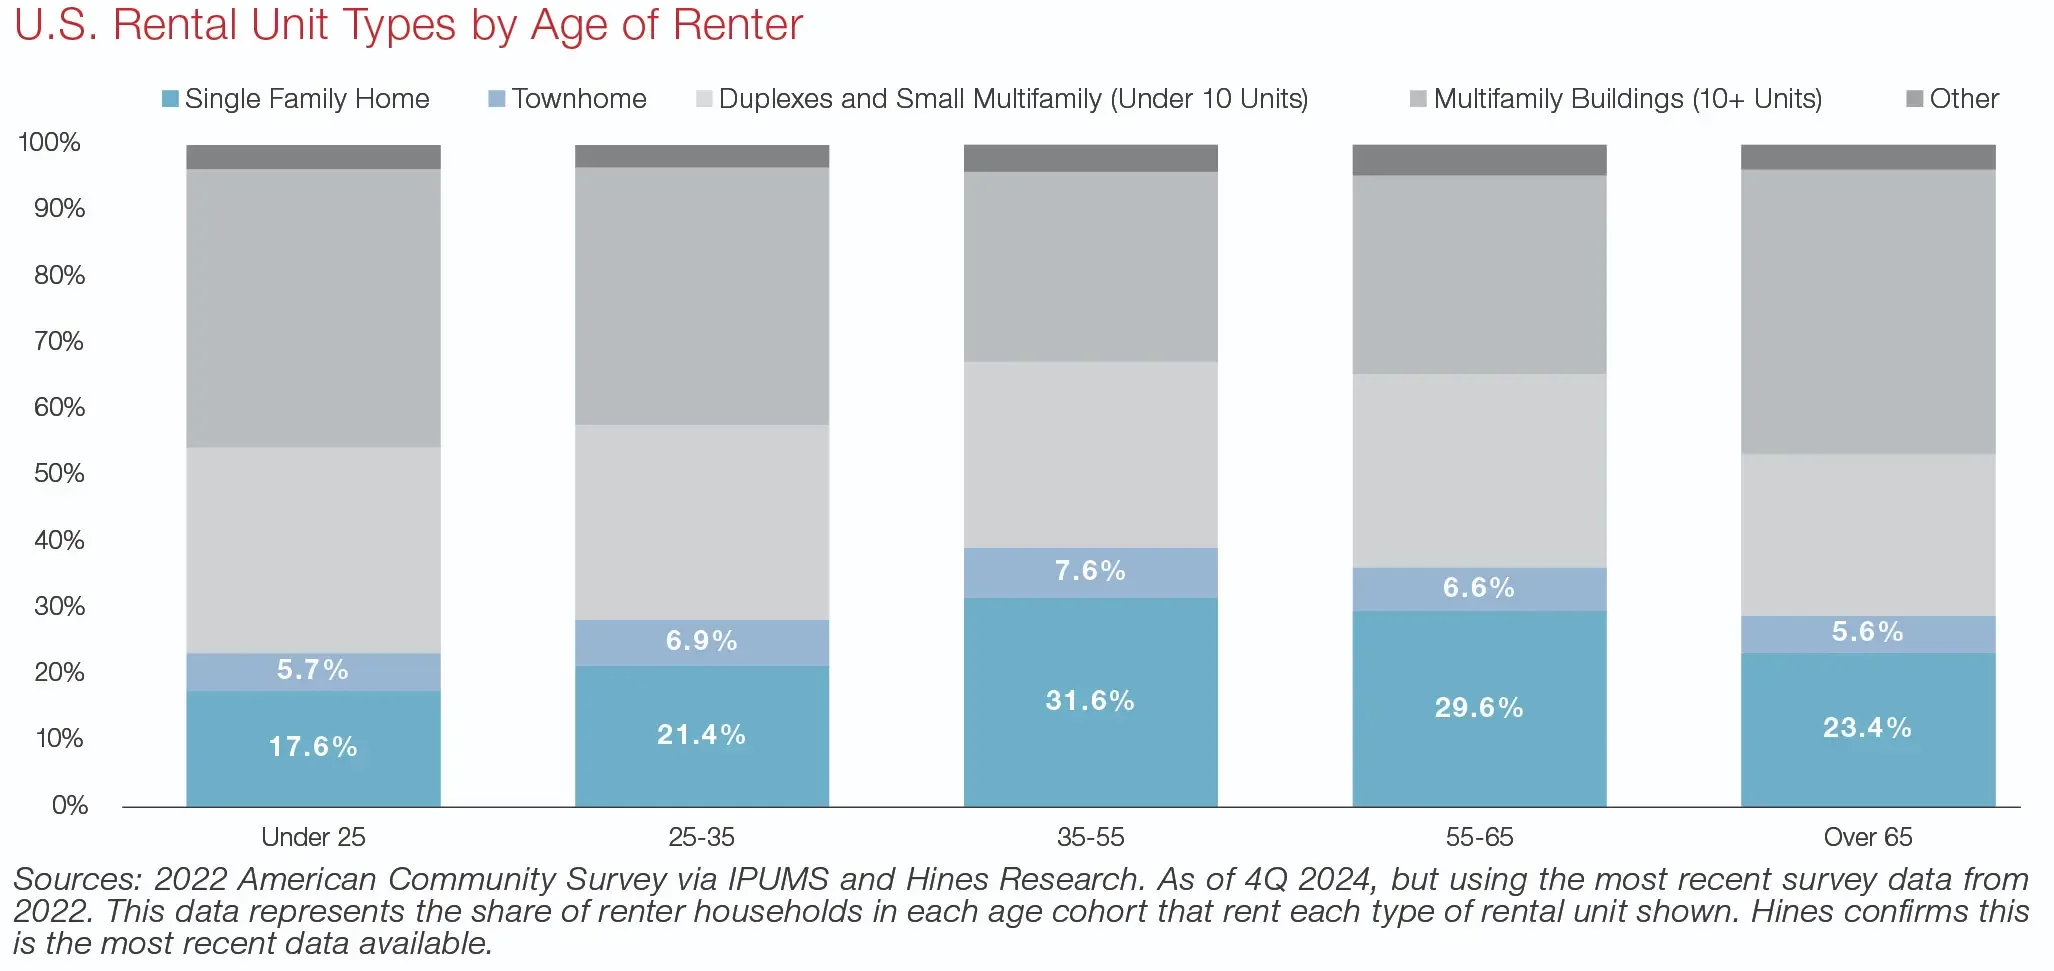
However, there is also a specific opportunity that is well-supported by demographic trends moving forward. With a growing population of renters aging into their prime child-raising years, we are seeing increased demand specifically in the single-family rental market.
Given unprecedented unaffordability levels, this seems to be the current answer for households needing more space but still leaning toward renting. On a historical basis, it is renters in the 35-55-year-old cohort that show the strongest demand for SFR, including detached homes and townhomes. While opportunities to build and lease up these bespoke communities can lead to attractive returns, another potential avenue for creating desirable housing supply for this cohort is “lot development,” or “horizontal” development of raw land. This concept secures entitlements to build out required infrastructure to sell on to homebuilders who have the optionality to create for-sale housing or purpose-built SFR communities. This approach allows the optionality of going either for-rent or for-sale and eschews construction and lease-up risk.
The cohorts older than 55 are not far behind. With a growing number of older Americans remaining healthier for longer, there could be a period of ten or more years where this demographic could also help spur increased SFR demand.
Exhibit 6: U.S. Rental Unit Types by Age of Renter
Trends in the European Living Sector
Most major European metro areas also face housing shortages, see Exhibit 7. In the aggregate, these cities need a net three million housing units, as of 4Q 2024. In fact, in country markets where we found national oversupply, namely France and Italy, the larger cities of Paris and Milan were actually undersupplied. There are also examples that go the other way: while our analysis found an ample shortfall in the U.K., Birmingham looked to be essentially in balance as of the date of the analysis in Exhibit 7. While rent control may make acquisitions less attractive in some European markets, typically building new product allows developers more leeway in setting rents at current market levels. The opportunity to acquire is still compelling in less-regulated markets, like the U.K., or in cases where the cost basis mitigates the impact of rent controls.
Given the above, perhaps an equally if not more compelling opportunity is to build new, fit-for-purpose product, what is called “Build to Rent” or BTR. The U.K. is a prime target for BTR given it has the second-largest shortfall in housing among the European countries we analyzed (see Exhibit 1), coupled with unaffordability in the major metros, and the U.K.’s relatively favorable regulatory environment.
Exhibit 7: European Housing Oversupply/(Shortfall) as a Percentage of Current Housing Stock
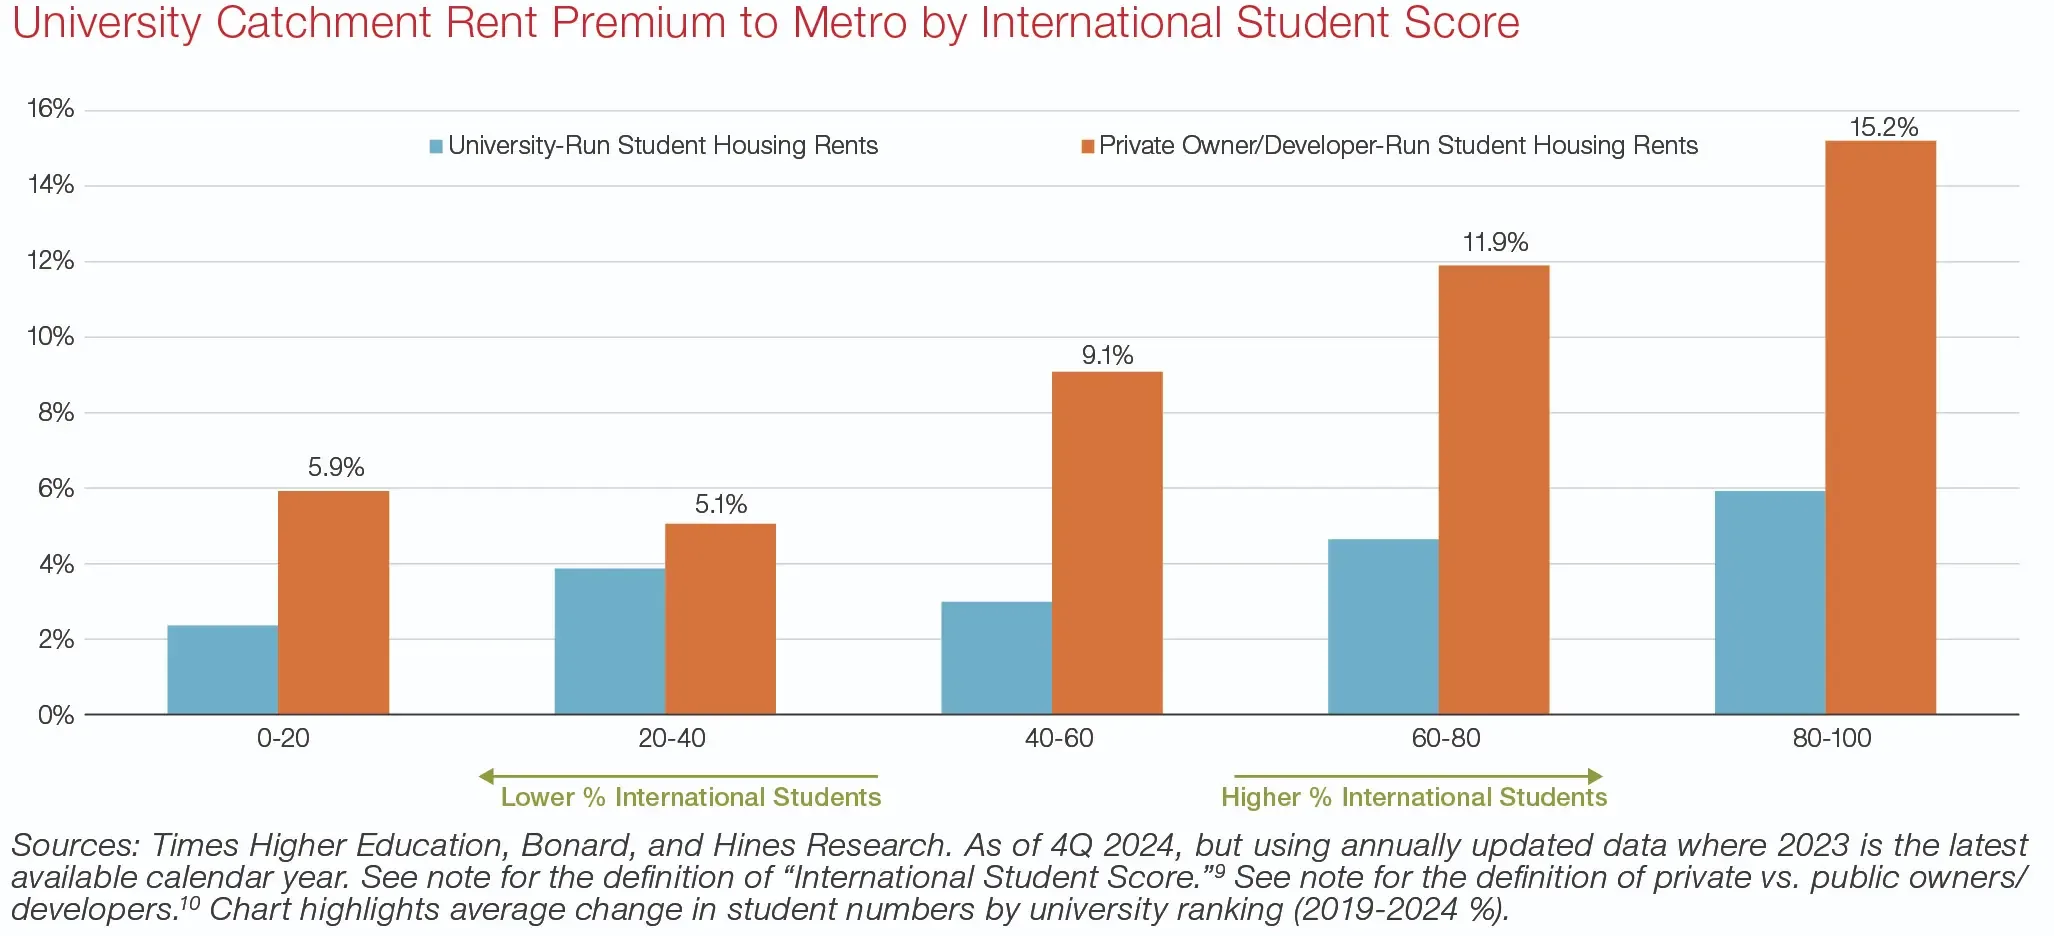
In addition to traditional for-rent multifamily investment, we also see a specific opportunity emerging in the student housing sector for European markets. While European demographics overall are arguably not inspiring, the secondary school cohort is currently growing and is forecasted to continue on that trajectory.7 That’s a driver of domestic demand, but another source of growth is underpinned by strong interest in European schools from international students. This combination has driven overall demand, but students (including international students in particular)8 tend to favor top-tier schools, see Exhibit 8. Focusing on schools where student enrollment has been growing, with a keen eye on the balance of supply, will likely be critical to successful investment in this living sub-type.
Exhibit 8: European University Demand Concentrated in Higher-Quality Institutions

To further highlight the impact of international student demand, in Exhibit 9, we’ve charted about 150 European universities by the relative percentage of their student body from elsewhere. Then, we studied the rent levels for student housing within a set distance from each university relative to average rents in that broader metro market. From that analysis, we found that schools with more international students saw significant rent premiums—by as much as 15% on average.
Exhibit 9: University Catchment Rent Premium to Metro by International Student Score
Trends in the Asia Living Sector
Asia has had a nascent traditional multi-family market that is still developing (comprising only 4.9% of total real estate market value in Asia, compared to 16.0% in Europe, and 35.7% in the U.S.)11 with Japan in the lead but with other markets starting to move up the curve. Investor demand for the overall living sector has begun to pick up, with a strong focus on Japan where the for-rent residential market is uniquely well-developed compared to other regional metro markets.12
Investors have also been focused on the potential for Australian BTR. While prices have recently fallen for homes there, improving affordability (though by no means inexpensive per our analysis in Exhibit 2, where a score below 30 is statistically indicative of being meaningfully inexpensive), the housing shortfall is still acute with one of the highest shortfalls as a percentage of housing inventory in Asia. Additionally, the lack of fit-for-purpose, bespoke for-rent residential stock is arguably a challenge for investors who are increasingly keen to acquire.
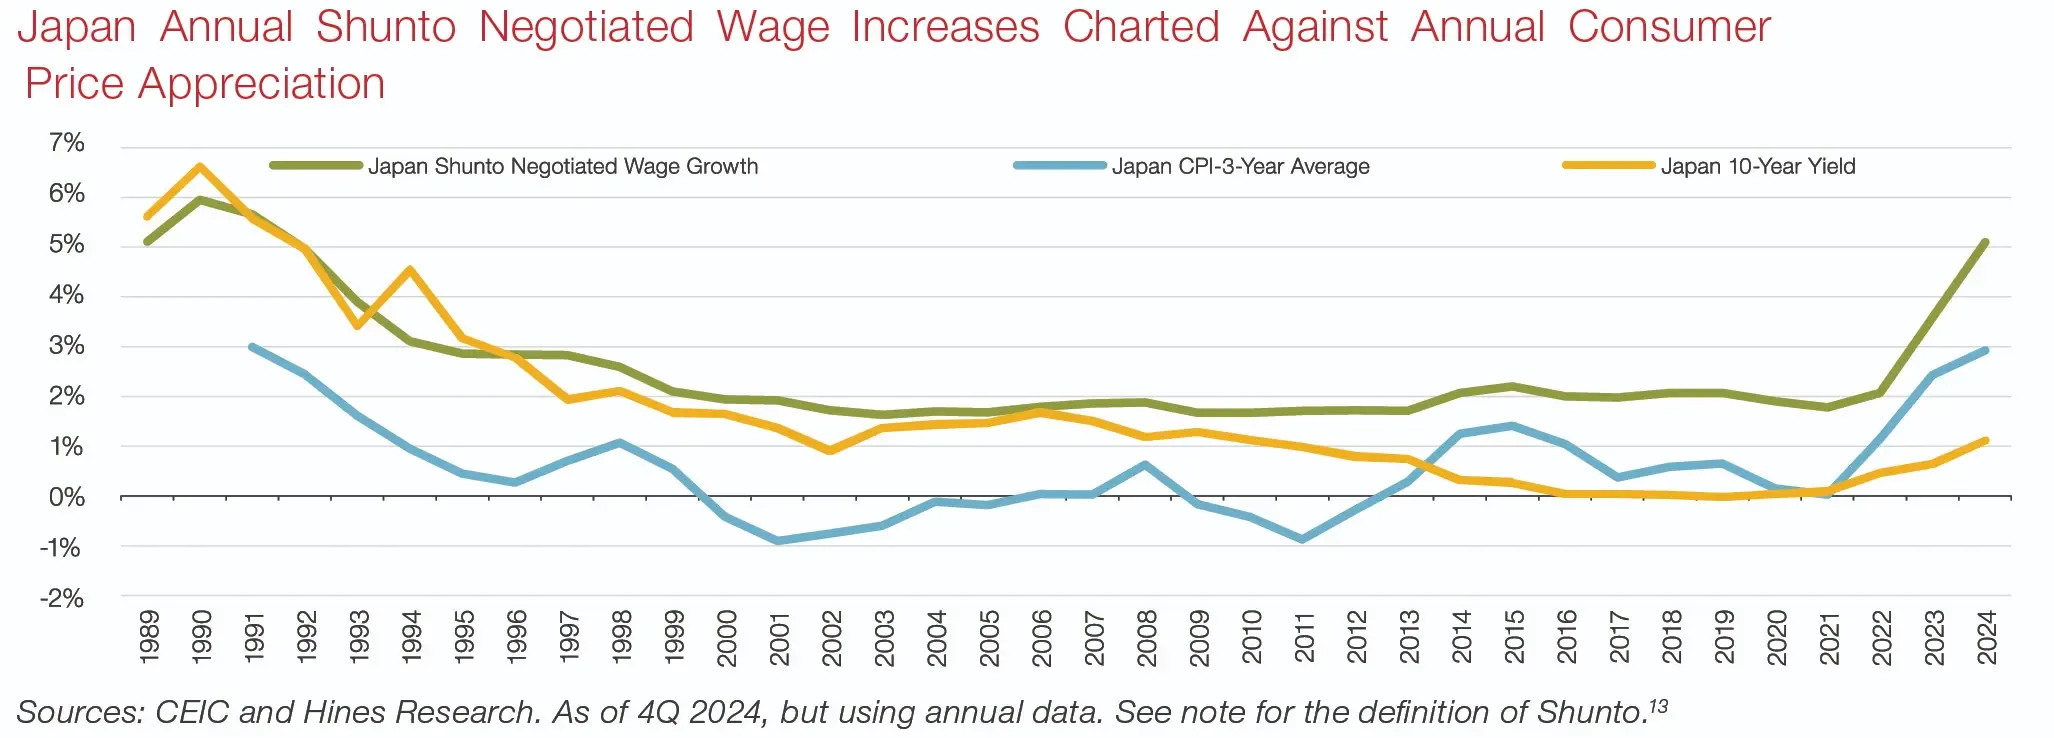
In Japan, capital markets have primarily driven performance for this sector. The market has benefitted from a secular upswing in transaction volumes coinciding with significant capitalization rate (cap rate) compression. A further tailwind for this trend of falling cap rates (and thus rising valuations, all things equal) have been falling or stable Japanese government bond yields, which have been at or close to zero from about 2010 through 2019.
However, that dynamic may be at an inflection point. Recently, government 10-year bond yields, the JGB, have risen in line with increased inflation, a new reality after almost 30 years of low inflation or outright deflation. The 10-year JGB was 1.1% at the end of 2024, and while still low relative to other country markets, that represents an absolute sea-change given that those yields were 0% at one point. And looking at Exhibit 10, there may be more to come.
One could argue that cap rate increases should have been in the offing, but an even sharper upswing in investor flows since about the middle of 2020 have kept cap rates declining. There are fair questions to ask now, such as: If inflation continues to accelerate in Japan, could rising 10-year yields (and debt costs) put a “cap” on cap rates, ending the cap rate compression tailwind? Even if the answer is yes, we believe the Japan for-rent residential market could be shifting to a new regime, potentially generating attractive returns for investors driven by price growth earned on the back of rent growth rather than flighty changes in cap rates. Additionally, we expect a critical driver of this rent growth will be a new upward trend in wages (another new reality) in response to rising inflation (see Exhibit 10).
Exhibit 10: Japan Annual Shunto Negotiated Wage Increases Charted Against Annual Consumer Price Appreciation
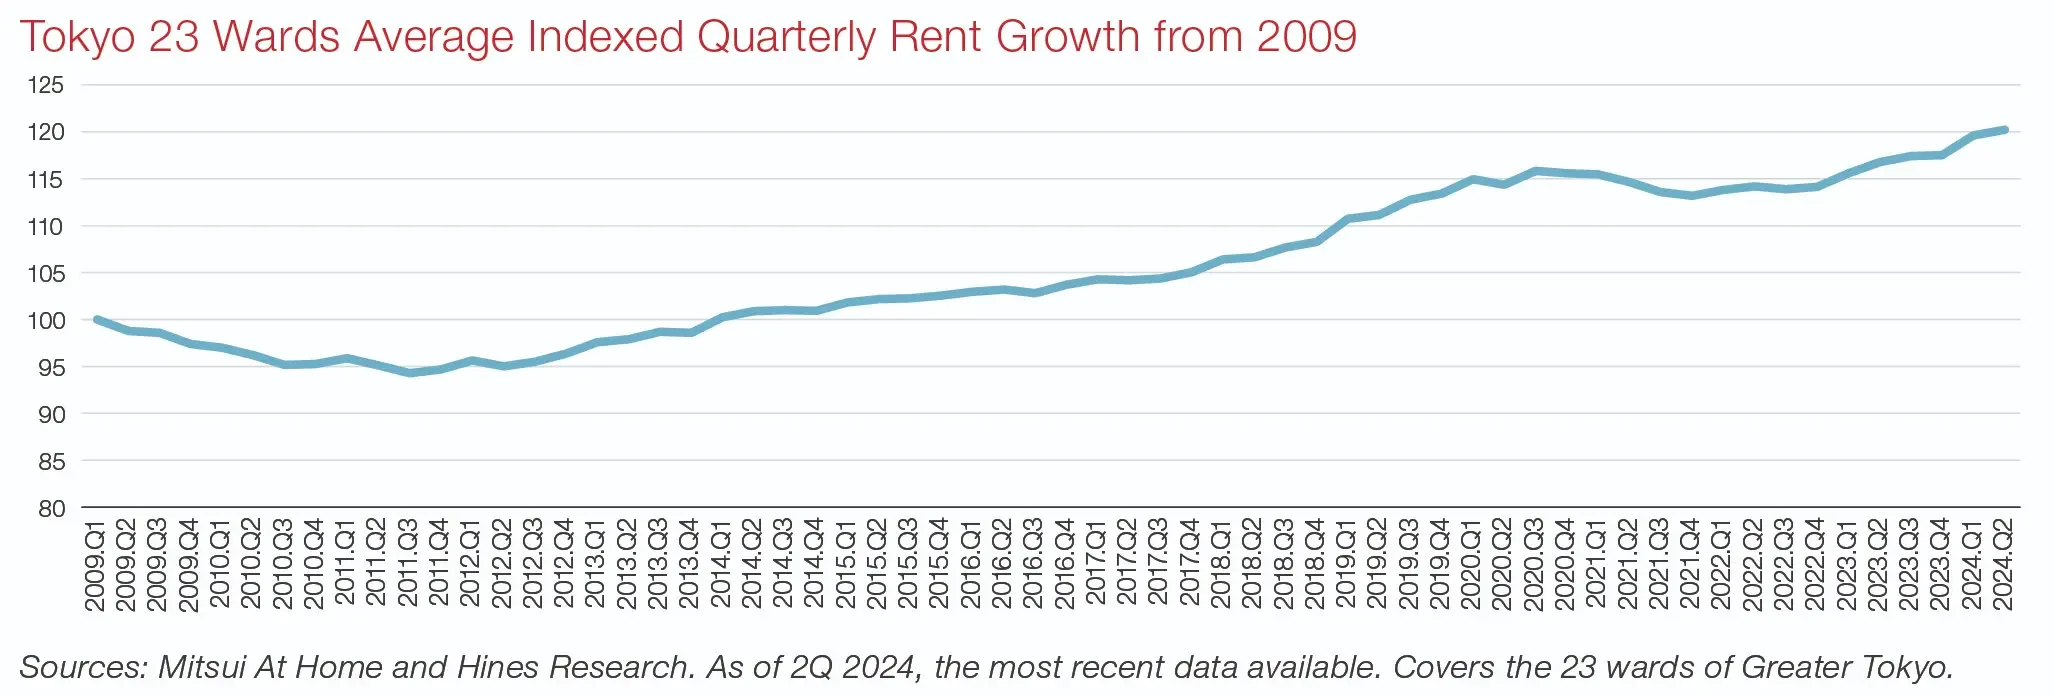
There is evidence that this is already happening. While apartment rents in Tokyo have been weaker over the last few years (peaking in the second half of 2020), rents have started to pick up sharply again (see Exhibit 11). If inflation and wage growth persist, this trend toward more convincing rent growth (and therefore stronger values) could become further entrenched.
Exhibit 11: Tokyo 23 Wards Average Indexed Quarterly Rent Growth from 2009
The Emerging Opportunity in South Korea
The South Korean living market looks similar to what we might have seen in Japan roughly 10 years ago (and also trails the increase in activity in Australia). Key characteristics of this market include strong demand, lack of institutional-quality supply, the emergence of more professional operators at scale, and institutional capital starting to look for opportunities.
Although local demographics may have investors concerned, there are two important trends to note:
- Population growth, even if very moderate, is still expected for Greater Seoul over the next 10 years, even if South Korea’s overall population is shrinking.14
- Average household sizes are decreasing. Given this, household growth is expected to remain positive. In fact, the forecast is for another 1.5 million households over the next 10 years, with almost two-thirds coming to Greater Seoul.15
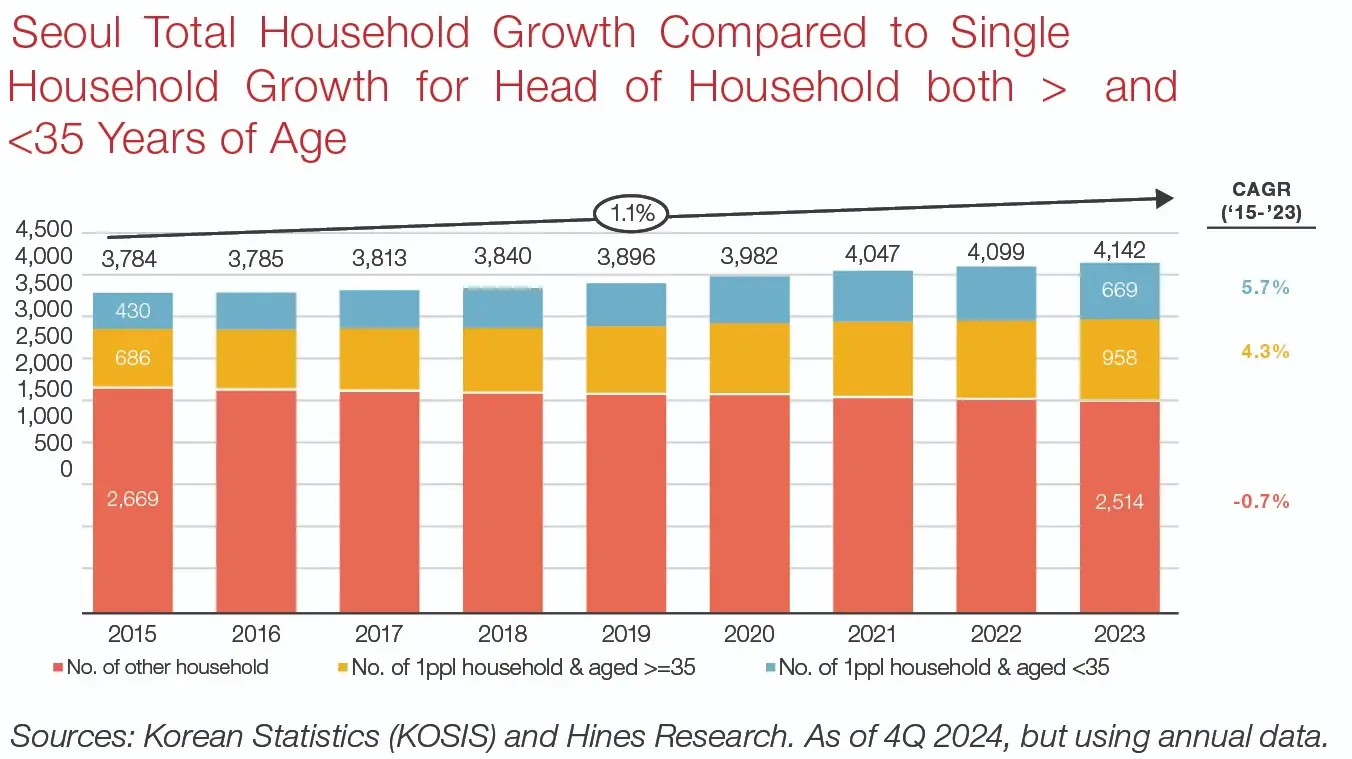
- In Seoul specifically, total household numbers have continued to increase moderately, driven primarily by single-person households in the under-35 cohort, who are more likely to rent (see Exhibit 12). We see an opportunity to cater to these potential renters through bespoke products with prized amenities.
Exhibit 12: Seoul Total Household Growth Compared to Single Household Growth for Head of Household both > and <35 Years of Age
Conclusion
Pressures including an acute housing supply shortage, unprecedented home affordability levels, and changing demographics have transformed the global living sector. We now see a pronounced proclivity to rent on a global scale, with over 80% of households in major developed economies showing momentum for renting over buying.16 Given these developments, key pockets of investment opportunity are emerging—specifically across the multifamily sector.
ABOUT THE AUTHOR AND THE HINES PROPRIETARY RESEARCH TEAM
Joshua Scoville
Head of Global Research

Michael C. Hudgins
Senior Managing Director

Joshua Scoville and his team, including Michael C. Hudgins, Senior Managing Director, the lead author on this paper, are responsible for constructing the Hines macroeconomic view and outlook for commercial real estate market fundamentals and pricing. Hines Research is also responsible for assisting with the development of investment strategies for the firm’s investment programs; working closely with the local and fund management teams, clients and partners; and supporting geographic leaders in identifying market/submarket opportunities and risks. The views of the local and fund management teams on the latest market developments are exchanged regularly via biweekly conference calls and quarterly market updates and are essential for reviewing investment strategies and fund portfolio allocations.
Additional members of Hines’ Proprietary Research team include Ryan McCullough, James Purvis, Tim Jowett, Erik Thomas, Michael Spellane, and Anthony Witkowski.
DISCLAIMER
Past performance is no guarantee of future results. Investing involves risks, including possible loss of principal. The opinions presented herein cannot be viewed as an indicator of future performance.
This document is being provided to you on a confidential basis for the sole purpose of providing you with initial and general information at your own responsibility. This document is not suitable to inform you of the legal and factual circumstances necessary to make an informed judgment about any prospective investment. Prospective investors are requested to inform themselves comprehensively and, in particular, to verify the contractual documentation that will be provided in the future.
Not An Offer
This article is for general information purposes only and does not constitute an offer or solicitation to buy or subscribe for securities, units or other financial instruments, nor does it constitute financial promotion, investment advice or an inducement to participate in any offering or investment.
This material contains information in the form of charts, graphs, and/or statements that we indicate were obtained by us from published sources or provided to us by independent third parties, some of whom we pay fees for such information. We consider such sources to be reliable. It is possible that data and assumptions underlying such third-party information may have changed materially since the date referenced. You should not rely on such third party information as predictions of future results. None of Hines Interests Limited Partnership (“Hines”), its affiliates or any third-party source undertakes to update any such information contained herein. Further, none of Hines, its affiliates or any third-party source purports that such information is comprehensive, and while it is believed to be accurate, it is not guaranteed to be free from error, omission or misstatement. Hines and its affiliates have not undertaken any independent verification of such information. Finally, you should not construe such third-party information as investment, tax, accounting, or legal advice.
This material contains projected results, forecasts, estimates, targets and other “forward-looking statements” concerning proposed and existing investment funds and other vehicles. Due to the numerous risks and uncertainties inherent in real estate investments, actual events or results or the actual performance of any of the funds or investment vehicles described may differ materially from those reflected or contemplated in such forward-looking statements. Accordingly, forward looking statements cannot be viewed as statements of fact. The projections presented are illustrations of the types of results that could be achieved in the given circumstances if the assumptions underlying them are met but cannot be relied on as accurate predictions of the actual performance of any existing or proposed investment vehicle.
The statements in this document are based on information that we consider to be reliable. This document does not, however, purport to be comprehensive or free from error, omission or misstatement. We reserve the right to alter any opinion or evaluation expressed herein without notice. Statements presented concerning investment opportunities may not be applicable to particular investors. Liability for all statements and information contained in this document is, to the extent permissible by law, excluded.
Endnotes
1 Sources: Oxford Economics, Eurostat, U.S. Census Bureau, Statistics Canada, Australian Bureau of Statistics, Statistics Korea, Hong Kong Census and Statistics Department, Statistical Bureau of Japan, and Hines Research. As of 4Q 2024 but data availability differs by country. Note that the analysis generally covers the period from 2010 to 2023, except for Japan (2013-2018), Korea (2016-2023), Canada (2011-2021), and Australia (2010-2020). For the stats provided, we had to assume that the homeownership rate for those three stayed the same from the last datapoint available through 2023. The countries we analyzed included: Spain, the Netherlands, Italy, Sweden, France, Germany, Denmark, United Kingdom, United States, Canada, Australia, South Korea, Japan, and Hong Kong.
2 Showing 14 developed economies for which data is available. The developed Europe data is an aggregate of underlying data from the developed European countries shown here, so effectively is a weighted average.
3 We calculate a ratio of home prices to nominal household disposable income over the period for which data is available by metro. Then we compare each quarter to the metro’s own history. We calculate a score for each quarter based on a normal distribution formula that uses a historical average and standard deviation of values to determine the 0-100 score where 100 is indicative that home prices are very expensive relative to the market’s own history.
4 Note that the analysis generally covers the period from 2010 to 2023 except for Japan (2013-2018), Canada (2011-2021), and Australia (2010-2020). For the stats provided, we had to assume that the homeownership rate for those three stayed the same from the last datapoint available through 2023. The bubbles are sized on the total number of households. Note that Hong Kong sits outside the chart like Germany, but is not highlighted. Measures are Momentum: -2.6%; and Delta to Average: -15.8%.
5 The analysis covers the period from the end of 2000 to present as ex-U.S. data becomes more consistently available across a wider range of markets. The trailing 2-year average annualized rent growth is calculated for all markets under coverage in the U.S. and the same but for just developed economies in Europe and Asia. The average trailing 2-year rent growth is calculated for each quarter by region and property type. Then the count of quarters of negative trailing 2-year average annualized rent growth is divided by the total count of quarters for each regional property type. That ratio for each global property type is a weighted average using Hines Research’s estimates of total market value (by property type) for the regions.
6 The Housing Market Composite Score is Hines’ proprietary pricing metric for assessing the relative affordability of home prices and a leading indicator of future home-price change. The Composite is comprised of the median home price-to-median income ratio and first-year buyer vs. renter cash flow percentiles relative to a market’s history. A score above 70 indicates that the housing market is relatively overpriced, below 30 indicates a relatively undervalued price, and 50 is equivalent to the market’s historical average.
7 Sources: Eurostat, UNESCO Institute for Statistics, and Hines Research. As of 1Q 2024.
8 Per analysis by Hines Research, approximately 58% of the European international student population is concentrated in European universities within the top 200 globally ranked universities. Source: Times Higher Education, Bonard, and Hines Research. As of 3Q 2024.
9 This score simply takes the number of international students at each school and converts it to a normal distribution where each number is assigned a number from 0-100 calculated using the sample average and standard deviation. Higher = more international students.
10 In exhibit 9, “private” refers to student accommodation properties developed by private developers, whereas “public” is a catch-all term for all other properties.
11 Sources: MSCI Real Capital Analytics, Oxford Economics, and Hines Research. As of 2Q 2024, using annual data estimates of total property market value (2023).
12 Sources: Oxford Economics, MSCI Real Capital Analytics, and Hines Research. As of 4Q 2024. Using Hines Research estimates of total property market value, Japan has the only metro markets (Tokyo, Osaka) analyzed by Hines Research where the apartment market makes up more than 10% of the total value for the four main property types (apartment, industrial, office, and retail).
13 Shunto is a Japanese term that can be translated as a spring wage offensive. It refers to wage talks held simultaneously by company unions throughout Japan every spring. It is considered a representative indicator of the overall Japanese corporate approach to wage increases and, as such, is watched closely.
14 Sources: Oxford Economics and Hines Research. As of 4Q 2024. Using Seoul, Incheon, and Gyeonggi-do for Greater Seoul.
15 Sources: Oxford Economics and Hines Research. As of 4Q 2024.
16 Sources: Oxford Economics, Eurostat, U.S. Census Bureau, Statistics Canada, Australian Bureau of Statistics, Statistics Korea, Hong Kong Census and Statistics Department, Statistical Bureau of Japan, and Hines Research. As of 4Q 2024 but data availability differs by country. Note that the analysis generally covers the period from 2010 to 2023 except for Japan (2013-2018), Korea (2016-2023), Canada (2011-2021), and Australia (2010-2020). For the stats provided, we had to assume that the homeownership rate for those three stayed the same from the last datapoint available through 2023.